

Test
Train
Repeat
WHY IT MATTERS NOW
Verified data isn’t a luxury anymore.
Most numbers in youth baseball are often self-reported, which means coaches discount them. A CURVE result is measured on the same equipment, under the same protocol, at each partner facility — and it shows progression across multiple test dates rather than one good day. Through our partnership with Prometric, the CURVE Test is standardized and validated. Numbers you can trust.

Standardized and validated in partnership with Prometric ↗
THE COMPLETE ATHLETE
Ball. Body. Brain.
The CURVE Test can be built into your club’s existing facility, delivering science-backed assessment using TrackMan, force plates and cognitive testing. It evaluates the whole athlete rather than one visible slice.
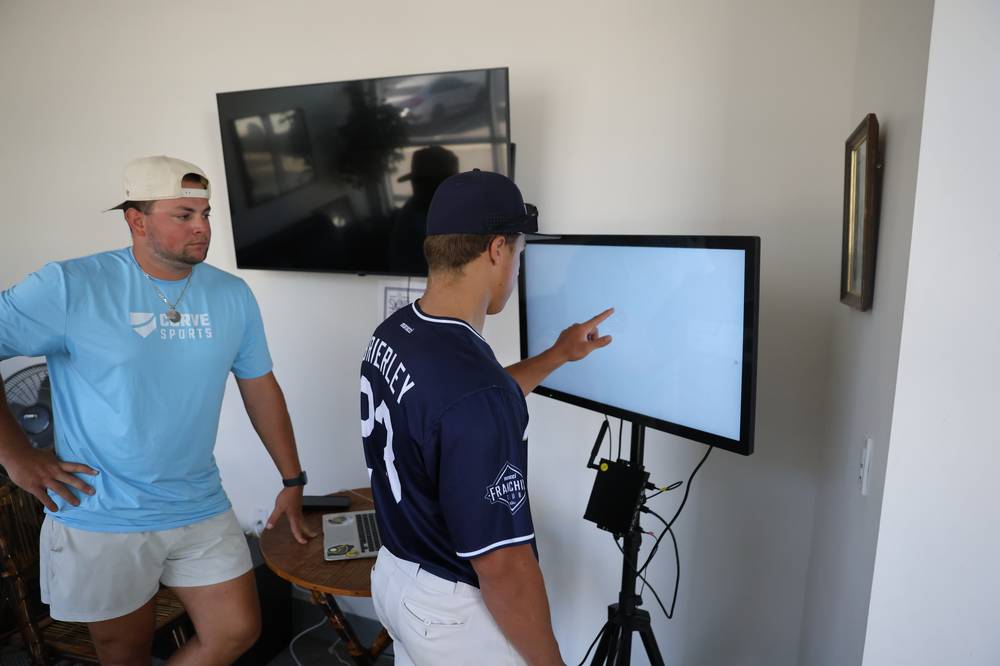
Ball
Hitting & pitching
Peak and average exit velocity, hard-hit and barrel percentage, launch angle — plus pitching velocity, spin rate, induced vertical and horizontal break, tilt, extension and strike percentage.

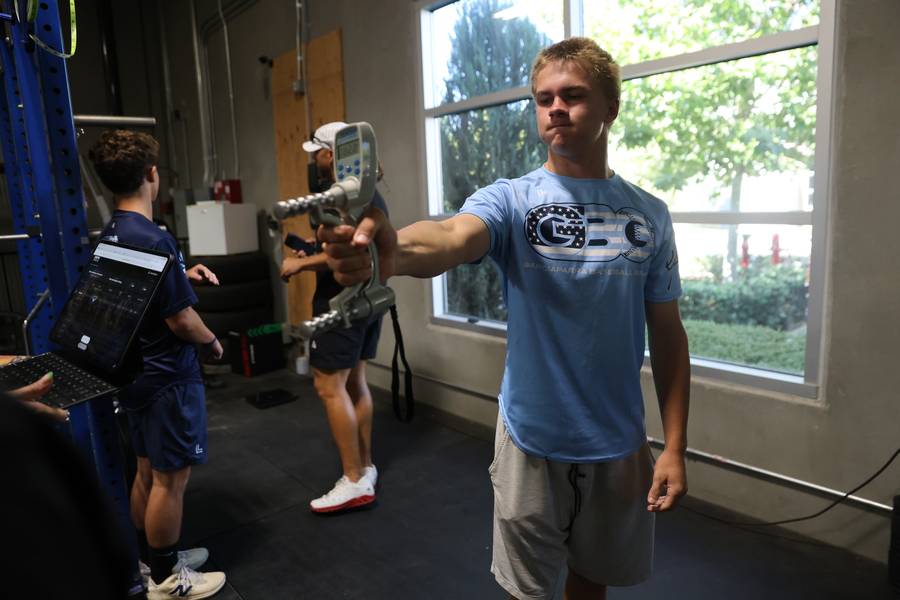
Body
Movement & power
Rotational strength and power that correlate directly to baseball movement — plus speed, agility and grip. Critical for throwing velocity, hitting power and injury prevention.
Brain
Cognitive & vision
Baseball is a mental game. We measure focus, reaction time, decision-making and pitch recognition to understand how well your brain performs under pressure.
WHAT WE TEST
Four assessments. Instant, actionable data.
Whether you test individual elements or the combined CURVE Test, results are immediate.
Ball
Hitting
Peak exit velocity, average EV50, hard-hit percentage, barrel percentage and launch angle.

Ball
Pitching
Peak and average velocity, spin rate, induced vertical and horizontal break, tilt, extension and strike percentage.
Body
Movement & power
Power, strength, speed and agility — the traits behind throwing velocity, hitting power and staying healthy.
Brain
Cognitive
Focus, reaction time and decision-making measured under pressure.
Everything, in one place.
Your CURVE report brings brain, body and ball together into a single profile — with percentile context so the numbers actually mean something. This is the real thing, tab by tab.
Pitching
Hitting
Spray & Flight
Body
Brain

Pitching.
Every pitch type measured — peak and average velocity, spin and extension.
Open the Live Example Report
BEST-IN-CLASS TECHNOLOGY
The equipment behind the numbers.

Prometric

Trackman

Proteus

Senaptec

Universal Speed Rating
VALD
VALD
THE EXPERTS
What college coaches say.

“I see parents sometimes chasing unrealistic dreams. I want to pass on all this knowledge and expertise in the industry and provide families and kids with true direction.”
Tracy Smith
Head Coach, Michigan

“We are entering a recruiting pandemic for high school age recruits due to the new roster rules and transfer portal.”
Erik Bakich
Head Coach, Clemson

“Everyone wants to be seen, and what can be seen is data. It’s hard to get in front of coaches of all these programs at once, so using data helps college coaches. As long as it’s reliable.”
Mike Early
Head Coach, Texas A&M

“The idea is to give all baseball players out there trying to get a coach’s attention a real validated, fact-based assessment of their strengths, their weaknesses, what they can work on, and where they are headed.”
Kevin O’Sullivan
Head Coach, Florida
USED BY
Organizations testing with CURVE.

Power Baseball

Pitch 2 Pitch

Knights Knation

Illinois Travel Baseball

GBG Baseball

San Diego Show
Questions about testing.
How long does it take?
The full test takes about 90 minutes including warm-up. Most clubs run testing days for a whole age group at once.
Do college coaches actually look at this data?
Who sees my results?
Do I need to play for the club to test there?
What each metric actually means.
Straight from the report. What it measures, why it matters, and how to improve it.
Peak exit velocity
Average exit velocity (EV50)
Hard hit %
Barrel %
10-yard dash
30-yard dash
5-10-5 agility
Vertical jump
Grip dynamometer
Senaptec sensory station
Perception span
Near-far shift
Reaction time